I’ve been commish in this league for a while now. We’ve tested about everything from different engines, to different rules, etc. Earlier in the year, my league had a discussion about re-evaluating our draft and looking for high value players.
Player Performance
Clearly it seems that QB’s are in a league of their own, but that’s pretty standard I would say across all leagues. This is a standard ESPN league with a few tweaks. I did however come across an interesting article suggesting that QB rules should be more rewarding and penalizing at the same time. 6 points for TDs and -4 for interceptions. Thus creating more separation for the elite QBs and potentially discourage streaming QBs to a playoff spot.
It’s pretty easy to spot the injuries, like David Johnson on the bottom left. But it’s definitely interesting to point out how well Todd Gurley, Mark Ingram, Marvin Jones, and Melvin Gordon (to name a few) looked. They all out-performed their projections. Gurley of course shattered his expectations, that probably stems from the help he got from Jared Goff and the rest of the Rams offense.
Just a note the projections were taken from Fantasy Football Analytics, they develop projections using custom rules from a league and a combination of different sources which includes: CBS Sports, ESPN, FantasyPros, NFL.com, Yahoo, etc. Go check it out http://fantasyfootballanalytics.net/.
Draft Results
So let’s take a quick look at the draft results. We should note that one or two injuries can immediately skew projections to be much greater than the actual points scored from players in each round. So that’s something to keep in mind.
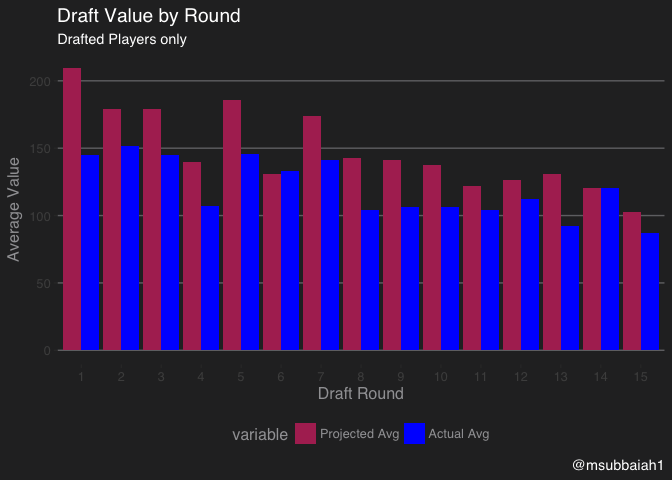
I’m a bit surprised to see Round 4’s projections to be quite low. Unsurprisingly, our Round 4 was filled with some serious injuries: Dalvin Cook, Allen Robinson, Terrelle Pryor, and Emmanuel Sanders. The catch in that round Kennan Allen and then Jarvis Landry. That was a rough one for sure.
As we move on to the later rounds, projected and actual average value seem to catch up with each other. Alright let’s move on to the draft valuation step.
Draft Valuation
It took a bit to figure out exactly how I wanted to go about the redraft process. At first, I was thinking about creating a valuation process and going from there. But that wouldn’t capture the effect of different positions.
Eventually, it came down to running a simple linear regression. Draft position was compared against players position, expected points, and expected position rank.
##
## Call:
## lm(formula = draft_pos ~ exp_pts + proj_posrank + playerposition,
##     data = dat_lin)
##
## Residuals:
##     Min      1Q  Median      3Q     Max
## -62.197 -13.186   0.714  12.428  48.403
##
## Coefficients:
##                  Estimate Std. Error t value Pr(>|t|)
## (Intercept)      117.6460    15.4368   7.621 3.65e-12 ***
## exp_pts           -0.2323     0.1122  -2.071  0.04023 *
## proj_posrank       2.4475     0.3195   7.661 2.94e-12 ***
## playerpositionK   17.4705     9.5927   1.821  0.07074 .
## playerpositionQB  12.4530    21.8001   0.571  0.56877
## playerpositionRB -78.9569    11.7289  -6.732 4.13e-10 ***
## playerpositionTE -23.8165     8.2819  -2.876  0.00467 **
## playerpositionWR -83.3243    11.2549  -7.403 1.19e-11 ***
## ---
## Signif. codes:  0 *** 0.001 ** 0.01 * 0.05 . 0.1 ' ' 1
##
## Residual standard error: 20.2 on 138 degrees of freedom
## Multiple R-squared:  0.7983, Adjusted R-squared:  0.7881
## F-statistic: 78.05 on 7 and 138 DF,  p-value: < 2.2e-16
Remember, the high value draft picks are at lower numbers. That should make it a bit easier to understand why some of the coefficients are negative. So with every added expected point, the players draft stock increase by -0.2.
It also captures the position battles very well, all RBs/WRs are to be drafted much earlier than most other positions. BA player immediately moves up about 78 spots in the draft, if they were a WR and about 83 spots for RBs. This suggests that K and QBs are to be drafted later (again it would be worth changing the rules for QBs). But there isn’t much to be had here as these variables are not very significant. The default position is D/ST, this was chosen by R not myself.
This model isn’t perfect but should be very capable of capturing an adequate redraft. Using the regression, the draft can be redone using actual points, actual position rank and of course position.
Model Diagnostics
Before we move forth with reconstructing the draft based on actual results, let’s study the validity of our model.
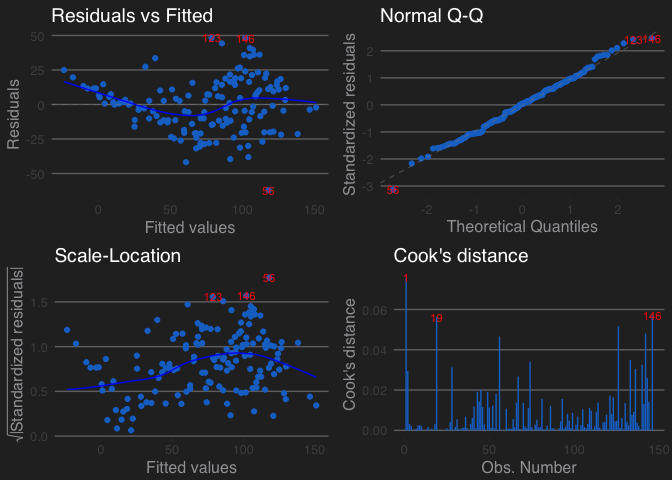
A couple of things we look for when running a linear regression, (1) is the data linear?, (2) do we have homoscedasticity?, (3) are the error terms normally distributed? and (4) are there many outliers?
Looking at the two plots on the left, we can come to conclusions about (1) and (2). The Residuals vs. Fitted plot shows a slight cure here, but besides that it mostly depicts a linear relationship. There is some concern, but not enough to warrant adding a quadratic term. The variance of the error terms are equal. The Scale-Location plot, in an ideal situation would have a horizontal blue line. However, we don’t have trends going in either direction and can thus claim that it is satisfactory enough to be homoscedastic.
The Q-Q plot helps understand whether the errors are normally distributed. An exactly linear relationship would show that errors are normally distributed. In this case with the exception of 3 outliers, there is a linear relationship.
Lastly, Cook’s distance is used to identify outliers. Here there are only 3 outliers, therefore there isn’t much to worry about and can continue using this regression model.
Overall the model looks satisfactory. We can move on to re-drafting now. Finally, the exciting stuff AM I RIGHT?!
Re-Drafting
I’ll go ahead and give you two different options to look at the redraft either through a table or a plot. The plot is interactive so hopefully that gives you a bit more detail.
| Player | Redrafted Position | Redrafted Round | Draft Position | Draft Round |
|---|---|---|---|---|
| Todd Gurley | 1 | 1 | 20 | 2 |
| LeVeon Bell | 2 | 1 | 2 | 1 |
| DeAndre Hopkins | 3 | 1 | 27 | 3 |
| Kareem Hunt | 4 | 1 | 56 | 6 |
| Antonio Brown | 5 | 1 | 3 | 1 |
| Melvin Gordon | 6 | 1 | 13 | 2 |
| Keenan Allen | 7 | 1 | 36 | 4 |
| Mark Ingram | 8 | 1 | 73 | 8 |
| Tyreek Hill | 9 | 1 | 60 | 6 |
| LeSean McCoy | 10 | 1 | 8 | 1 |
| Marvin Jones | 11 | 2 | 139 | 14 |
| Leonard Fournette | 12 | 2 | 23 | 3 |
| Julio Jones | 13 | 2 | 4 | 1 |
| Brandin Cooks | 14 | 2 | 26 | 3 |
| Ezekiel Elliott | 15 | 2 | 9 | 1 |
| Larry Fitzgerald | 16 | 2 | 57 | 6 |
| Jordan Howard | 17 | 2 | 18 | 2 |
| A.J. Green | 18 | 2 | 16 | 2 |
| Carlos Hyde | 19 | 2 | 34 | 4 |
| Adam Thielen | 20 | 2 | 102 | 11 |
| Davante Adams | 21 | 3 | 48 | 5 |
| Devonta Freeman | 22 | 3 | 7 | 1 |
| Doug Baldwin | 23 | 3 | 22 | 3 |
| Lamar Miller | 24 | 3 | 24 | 3 |
| Jarvis Landry | 25 | 3 | 39 | 4 |
| Christian McCaffrey | 26 | 3 | 31 | 4 |
| Alshon Jeffery | 27 | 3 | 33 | 4 |
| C.J. Anderson | 28 | 3 | 62 | 7 |
| Stefon Diggs | 29 | 3 | 83 | 9 |
| Frank Gore | 30 | 3 | 55 | 6 |
| Golden Tate | 31 | 4 | 59 | 6 |
| Marshawn Lynch | 32 | 4 | 29 | 3 |
| Mike Evans | 33 | 4 | 5 | 1 |
| Latavius Murray | 34 | 4 | 131 | 14 |
| Duke Johnson | 35 | 4 | 128 | 13 |
| Demaryius Thomas | 36 | 4 | 32 | 4 |
| Russell Wilson | 37 | 4 | 68 | 7 |
| Tevin Coleman | 38 | 4 | 81 | 9 |
| T.Y. Hilton | 39 | 4 | 21 | 3 |
| Dez Bryant | 40 | 4 | 17 | 2 |
| DeMarco Murray | 41 | 5 | 15 | 2 |
| Michael Crabtree | 42 | 5 | 53 | 6 |
| Rob Gronkowski | 43 | 5 | 19 | 2 |
| Derrick Henry | 44 | 5 | 103 | 11 |
| Amari Cooper | 45 | 5 | 14 | 2 |
| Travis Kelce | 46 | 5 | 43 | 5 |
| Bilal Powell | 47 | 5 | 58 | 6 |
| Cam Newton | 48 | 5 | 64 | 7 |
| Sammy Watkins | 49 | 5 | 63 | 7 |
| Isaiah Crowell | 50 | 5 | 25 | 3 |
For the sake of keeping the table simple, we shall only look at the first five rounds. So the re-draft is already showing some changes, by only suggesting 3 of the original first rounders to remain in the first round. Looks like Hopkins, Hunt and Ingram were all steals outside of the first round.
Even with Zeke’s suspensions, he is a 2nd rounder. To be fair though, the guy who drafted Zeke had two first round draft picks and Zeke was his second pick. Yep, I went with the Billicheck and tried to get more picks in the top 50 by trading down. Needless to say it was not my year, not a lot of my players panned out. But, looking back at the draft and the re-draft. I would trade down AGAIN.
It’s surprising to see a couple of 11 rounders and onwards up here. But you have to factor into account injuries to some of the other players. Latavius Murray wouldn’t be so high on the list if it wasn’t for Dalvin’s injury.
Anyway’s I’ll lead you browse through the rest of it. If you want all of the data, you can download it from the chart below.
For Injuries: look in the top left corner. (Michael Thomas, David Johnson, etc) For Busts: look for anyone above the 100 redrafted position. Don’t forget about the waiver wire! For Steals: look in the top right corner. (Adam Thienlen, Duke Johnson, Marvin Jones, etc)
So much for all the hype on Crowell, Johnson is the guy to have from Cleveland which makes sense. Cleveland always goes down, and then they need their pass-catching back in the game. Hell they even run him out of the slot. Hopefully the Browns can turn it around sometime soon.
Code
I performed everything in R, data extraction, analysis and even visualization. I normally prefer to go with Python and BeautifulSoup, but it was pretty simple with R and the rvest package.
To extract the data from your own league, make sure that it is a public league on ESPN. For Yahoo, they have an API key you can sign up for and extract data from. Not sure about NFL.com, I try to avoid playing in those leagues!
If you are interested in re-creating the interactive visuals, I used the R wrapper to highcharter (JS). The code can be found in the Rmarkdown for the analysis.